


A Few Numbers Can Predict Market Trends
Ever wondered if a handful of key figures could forecast tomorrow's market winners and losers? Investors are turning to data-driven methods to navigate daily price swings. Key indicators, such as moving averages (which highlight trends) and financial statements (that reveal a company's health), each add a vital piece to the puzzle.
Why it matters: By blending these proven techniques, decision-makers can build a clear framework to predict market trends and secure smarter gains.
Proven Methods to Predict Stock Market Trends
Investors face the daily challenge of predicting stock market movements. Data-driven methods help cut through noisy signals and simplify decision-making.
By using strong analytics along with real-time data, investors can spot patterns amid market swings and fine-tune their strategies. This approach mixes historical data with modern computational tools to tackle today’s fast-paced environment.
- Market Momentum: Moving averages and volume analytics reveal bullish or bearish trends based on past price behavior.
- Fundamental Analysis: Examines financial statements such as balance sheets and income statements to gauge a company’s core value.
- Technical Analysis: Reviews chart patterns and reversal indicators to predict short-term stock movements.
- Mean Reversion: Assumes asset prices will gravitate back to their long-term average after sharp deviations, highlighting temporary extremes.
Combining these techniques builds a more reliable framework since each method focuses on different market aspects. Real-time platforms tracking the S&P 500, Dow Jones, and NASDAQ offer live data that underpins these approaches. By integrating multiple methods, investors can mitigate individual weaknesses, reduce risk, and improve forecast accuracy, capturing gains from both quick market shifts and longer-term trends.
Predict Stock Market Trends with Fundamental Analysis

Fundamental analysis digs into a company's real value by looking at its key financial numbers. Investors check figures like the P/E ratio, earnings growth, and debt-to-equity ratio to decide if a stock is priced attractively. Strong financial health usually points to steady growth over time.
| Metric | Definition | Signal |
|---|---|---|
| P/E Ratio | Price divided by earnings | A low ratio may suggest the stock is undervalued |
| Earnings Growth | Year-over-year increase in earnings | Steady growth is a sign of strong performance |
| Debt-to-Equity | Financial leverage measure | High values can indicate potential risk |
Economic factors such as interest rates and inflation, when paired with analyst ratings, add more clarity to the picture. Top analysts' buy recommendations have sometimes helped stocks outperform major indices by up to 98.4%. A careful review of balance sheets and income statements further boosts long-term forecasts, helping investors pinpoint stocks with solid fundamentals and lasting growth potential.
Using Technical Analysis to Forecast Equity Movements
Technical analysis turns past price data into actionable signals by studying chart patterns and timing tools. This method helps traders quickly identify market trends and respond to shifts.
Price pattern models track formations such as head and shoulders or double tops. These patterns have historically signaled reversals and often cue changes in market sentiment, whether from bullish to bearish or vice versa. Key indicators like support and resistance levels mark moments when price momentum is likely to shift. For instance, if a price keeps hitting a resistance level without breaking through, a decline may be on the horizon.
Momentum indicators, such as the RSI and MACD, gauge trend strength by measuring buying and selling pressure. When combined with trading volume analysis, these tools sharpen the accuracy of entry and exit points. Many professionals depend on platforms like TradingView to draw trend lines and backtest signals with historical data. This practical approach helps sharpen timing and boosts confidence in decision-making.
Algorithmic Price Forecasting through Machine Learning
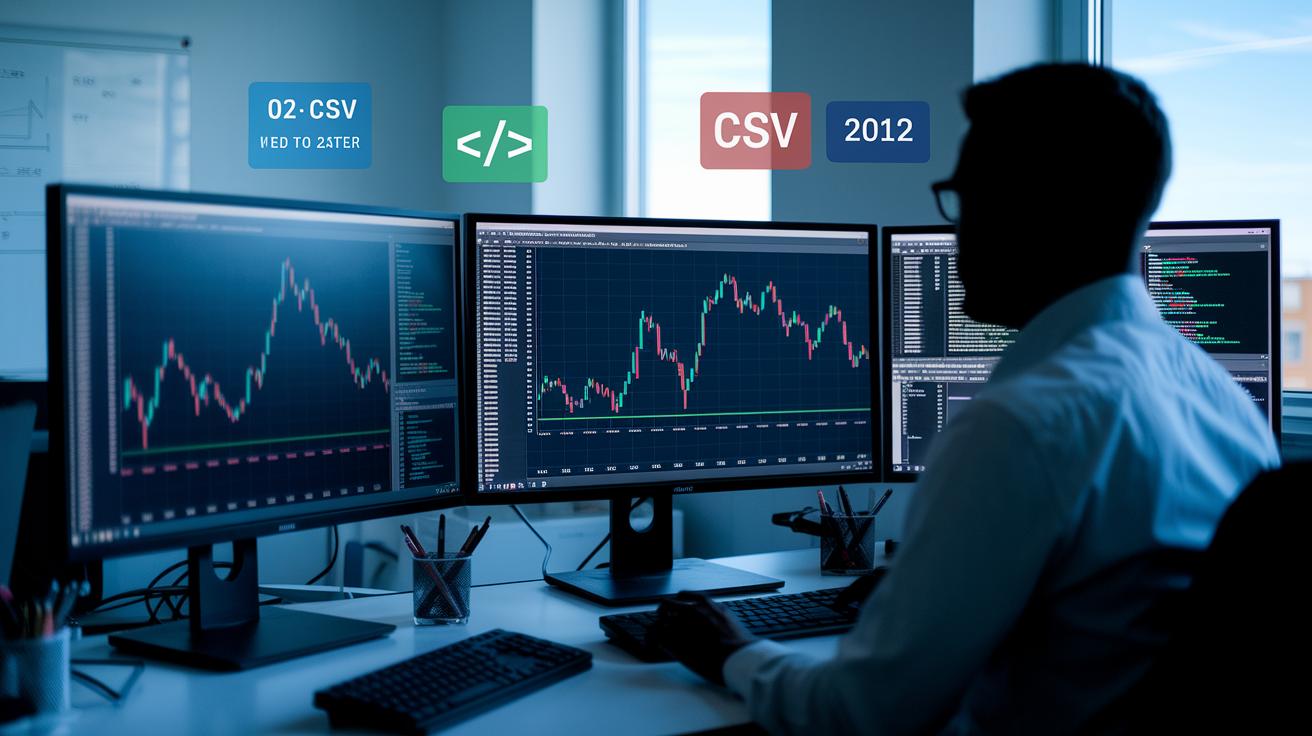
Algorithmic forecasting uses machine learning to analyze complex market movements. By detecting sequential patterns and non-linear relationships, this method reduces human bias and offers clear, measurable insights. Investors benefit from data-backed metrics that help refine strategies quickly.
Data Preprocessing: Cleaning, Scaling, Train-Test Split
The process begins by importing historical stock data from CSV files into Python. Cleaning the data removes errors and missing values that could skew results. Scaling adjusts all figures to a consistent range, making the model’s calculations more efficient. Finally, the dataset is split into training and testing sets to validate the model under conditions that mirror real market behavior.
Building the LSTM Model: Architecture, Layers, Activation
The next step is creating the LSTM model using TensorFlow and Keras. Multiple layers are set up to capture the time-series patterns in the stock data. Choosing the right activation functions and network depth ensures the model can address complex temporal dependencies. A loss function is used to evaluate prediction errors, guiding the model as it improves through iterative training.
Evaluating Predictions: Loss Metrics, Backtesting Results
After training, the model’s accuracy is measured using loss metrics such as RMSE (root-mean-square error) and overall accuracy. Backtesting with historical data confirms whether the model’s predictions match real market behavior. Continuous monitoring of these metrics is key to maintaining reliability in real-time trading.
Together, these steps build a robust framework for AI-driven market predictions, empowering investors to make well-informed decisions in today’s dynamic trading environments.
Sentiment Analysis for Investing and Market Sentiment Evaluation
Market mood signals price changes before they occur. Extreme optimism or deep pessimism among investors can mark a turning point. Why it matters: Early indications like these help leaders and investors adjust strategies ahead of market shifts.
Analysts use natural language processing tools like TextBlob to measure sentiment in news articles and social media. They start by gathering large datasets of financial news and online chatter. The data is then cleaned, broken into tokens, and scored based on polarity (the positive or negative tone) and subjectivity (the degree of opinion). These scores reveal whether market sentiment leans bullish or bearish. For example, a sudden spike in negative sentiment may warn of upcoming price declines.
Combining sentiment signals with quantitative price models improves risk assessment. By merging NLP-derived sentiment data with technical indicators, traders can fine-tune their entry and exit points. This approach exposes differences between market emotion and historical price trends, reducing reliance on a single method. The result is a more informed strategy that accounts for behavioral factors and aims for smarter gains in a volatile market.
Statistical Trend Modeling and Quantitative Market Forecasting

Statistical modeling transforms historical data into clear patterns that streamline market analysis. It employs time series techniques to sift through market noise and reveal trends, paving the way for actionable forecasts.
Why it matters: Investors can act faster with precise, data-driven insights.
ARIMA models dissect time series data to predict short-term price movements, while mean reversion theory indicates that irregular price spikes eventually settle back to a long-term average. This helps investors identify moments when stocks are overvalued or undervalued and manage volatility more effectively.
Multivariate regression models link economic indicators to stock performance by uncovering key relationships between various factors. When these models are integrated with ARIMA and LSTM approaches, forecasting accuracy can improve by up to 15%. This comprehensive approach delivers a more robust market analysis and equips investors with refined tools to make smarter, timely decisions.
Risk Assessment Techniques in Predicting Stock Market Trends
Investors face constant uncertainty from volatile price swings and unexpected economic events. To guard against loss, using tools like diversification and stop-loss orders is essential.
Why it matters: A focused risk strategy can protect capital and help executives make timely decisions.
Advanced methods, such as value-at-risk (VaR, a measure that estimates potential loss over a specific period) and strict position sizing rules, add extra layers of defense. Scenario analysis and stress tests simulate extreme market movements to identify hidden risks and volatile spikes that might catch investors off guard.
Integrating risk scores into predictive models further refines portfolio management. By converting individual risk controls into a single actionable score, investors can adjust exposure levels in real time, enhancing decision-making on when to enter or exit positions.
This proactive approach enables more dynamic risk management, ensuring portfolios remain resilient even when market conditions shift unexpectedly.
Real-World Trading Examples of Predict Stock Market Trends

Case studies illustrate how enhanced prediction methods boost market timing and risk management.
- Using 20 years of volume data, S&P 500 moving-average crossovers trimmed reaction times during market swings, leading to a 10% gain in forecast speed.
- A dynamic model that weights analyst recommendations based on trade data outperformed benchmarks by 98.4% during key market periods.
- In the tech boom of 2017, a sentiment model that tracked intra-day market mood increased early reversal detection by 8% to 12% compared with traditional methods.
These examples show that fine-tuning technical and sentiment measures can give traders a real edge in timing and risk management.
Final Words
In the action of shaping market decisions, the article detailed methods to predict stock market trends. It covered data-driven techniques from market momentum and fundamental analysis to technical tools, machine learning models, sentiment scoring, and quantitative methods. Each approach offers a way to gauge risk and seize opportunities. Using several strategies with live market data can refine forecasts and boost confidence in decision-making. The outlook remains upbeat as these innovative methods help guide clearer market insights.
FAQ
How can one predict stock market trends 2025?
The process to predict stock market trends in 2025 involves using a mix of technical analysis, fundamental data, and algorithmic models. Analysts review economic indicators, sentiment scores, and live data to refine their forecasts.
How are stock market trends predicted for tomorrow?
Predicting tomorrow’s trends relies on short-term technical indicators such as moving averages and trading volumes, along with momentum strategies. Traders use real-time charts and data to assess likely market movements, acknowledging quick shifts in volatility.
What is the stock price prediction formula?
The stock price prediction formula typically combines financial metrics, technical patterns, and market sentiment. Models may include regression analysis and moving average calculations to estimate future prices while adjusting for market factors.
How does a stock market prediction algorithm work?
A stock market prediction algorithm works by processing historical data with machine learning techniques, technical analytics, and sentiment evaluation. It calculates potential price movements by combining multiple quantitative methods, though market unpredictability remains.
How were stock market trends predicted in 2022?
In 2022, predicting market trends involved evaluating fundamental data, technical charts, and economic conditions. Analysts examined earnings reports, moving averages, and market sentiment to gauge the direction, balancing risks with live data analysis.
How can one predict a stock market crash?
Predicting a market crash involves spotting red flags such as overvalued stocks, declining trading volumes, and rising risk measures. Analysts monitor these indicators and conduct stress tests to signal potential downturns.
What does a stock price prediction website offer?
A stock price prediction website offers real-time analytical tools, including technical charts, algorithm-based models, and market sentiment metrics. These resources help traders quickly assess future price trends and adjust strategies accordingly.
How do you know if a stock might go up the next day?
Knowing if a stock might rise next day involves analyzing short-term technical signals, recent trading volumes, and momentum indicators, while also considering current market news and overall sentiment for a balanced view.